Home
7 Strategic Executive Dashboard Examples for High Impact Leadership

Modern business environments generate an overwhelming volume of data, yet senior leaders often find themselves starved for actionable insights. An executive dashboard serves as the central nervous system of an organization, consolidating fragmented metrics into a single, high-signal interface. Unlike operational reports that focus on day-to-day tasks, these strategic tools are designed to answer one fundamental question: Are we winning?
Effective executive dashboards act as the cockpit instrumentation for leadership. They do not just display what happened; they provide the context needed to understand why it happened and what steps must be taken next. By focusing on high-level Key Performance Indicators (KPIs), these dashboards empower CEOs, CFOs, and other C-suite members to make data-driven decisions with speed and precision.
The CEO Strategic Dashboard for Total Organizational Health
The Chief Executive Officer requires a 360-degree view of the entire enterprise. This dashboard is not about the minutiae of a single department but the alignment of all departments toward long-term strategic goals. In our experience building these frameworks, the most effective CEO dashboards prioritize trends over static numbers.
Core KPIs for Global Oversight
- Total Revenue vs. Target: This is the primary "North Star" metric. It should be visualized alongside the quarterly or annual budget to show real-time progress.
- Net Promoter Score (NPS): A critical indicator of long-term brand health and customer loyalty. A sudden dip here often precedes financial decline.
- Operating Margin: This measures the efficiency of the entire business model, showing how much profit is generated from each dollar of sales after paying for variable costs.
- Market Share: Tracking position relative to competitors ensures the company isn't growing in a vacuum while others grow faster.
Decision Impact and Visualization
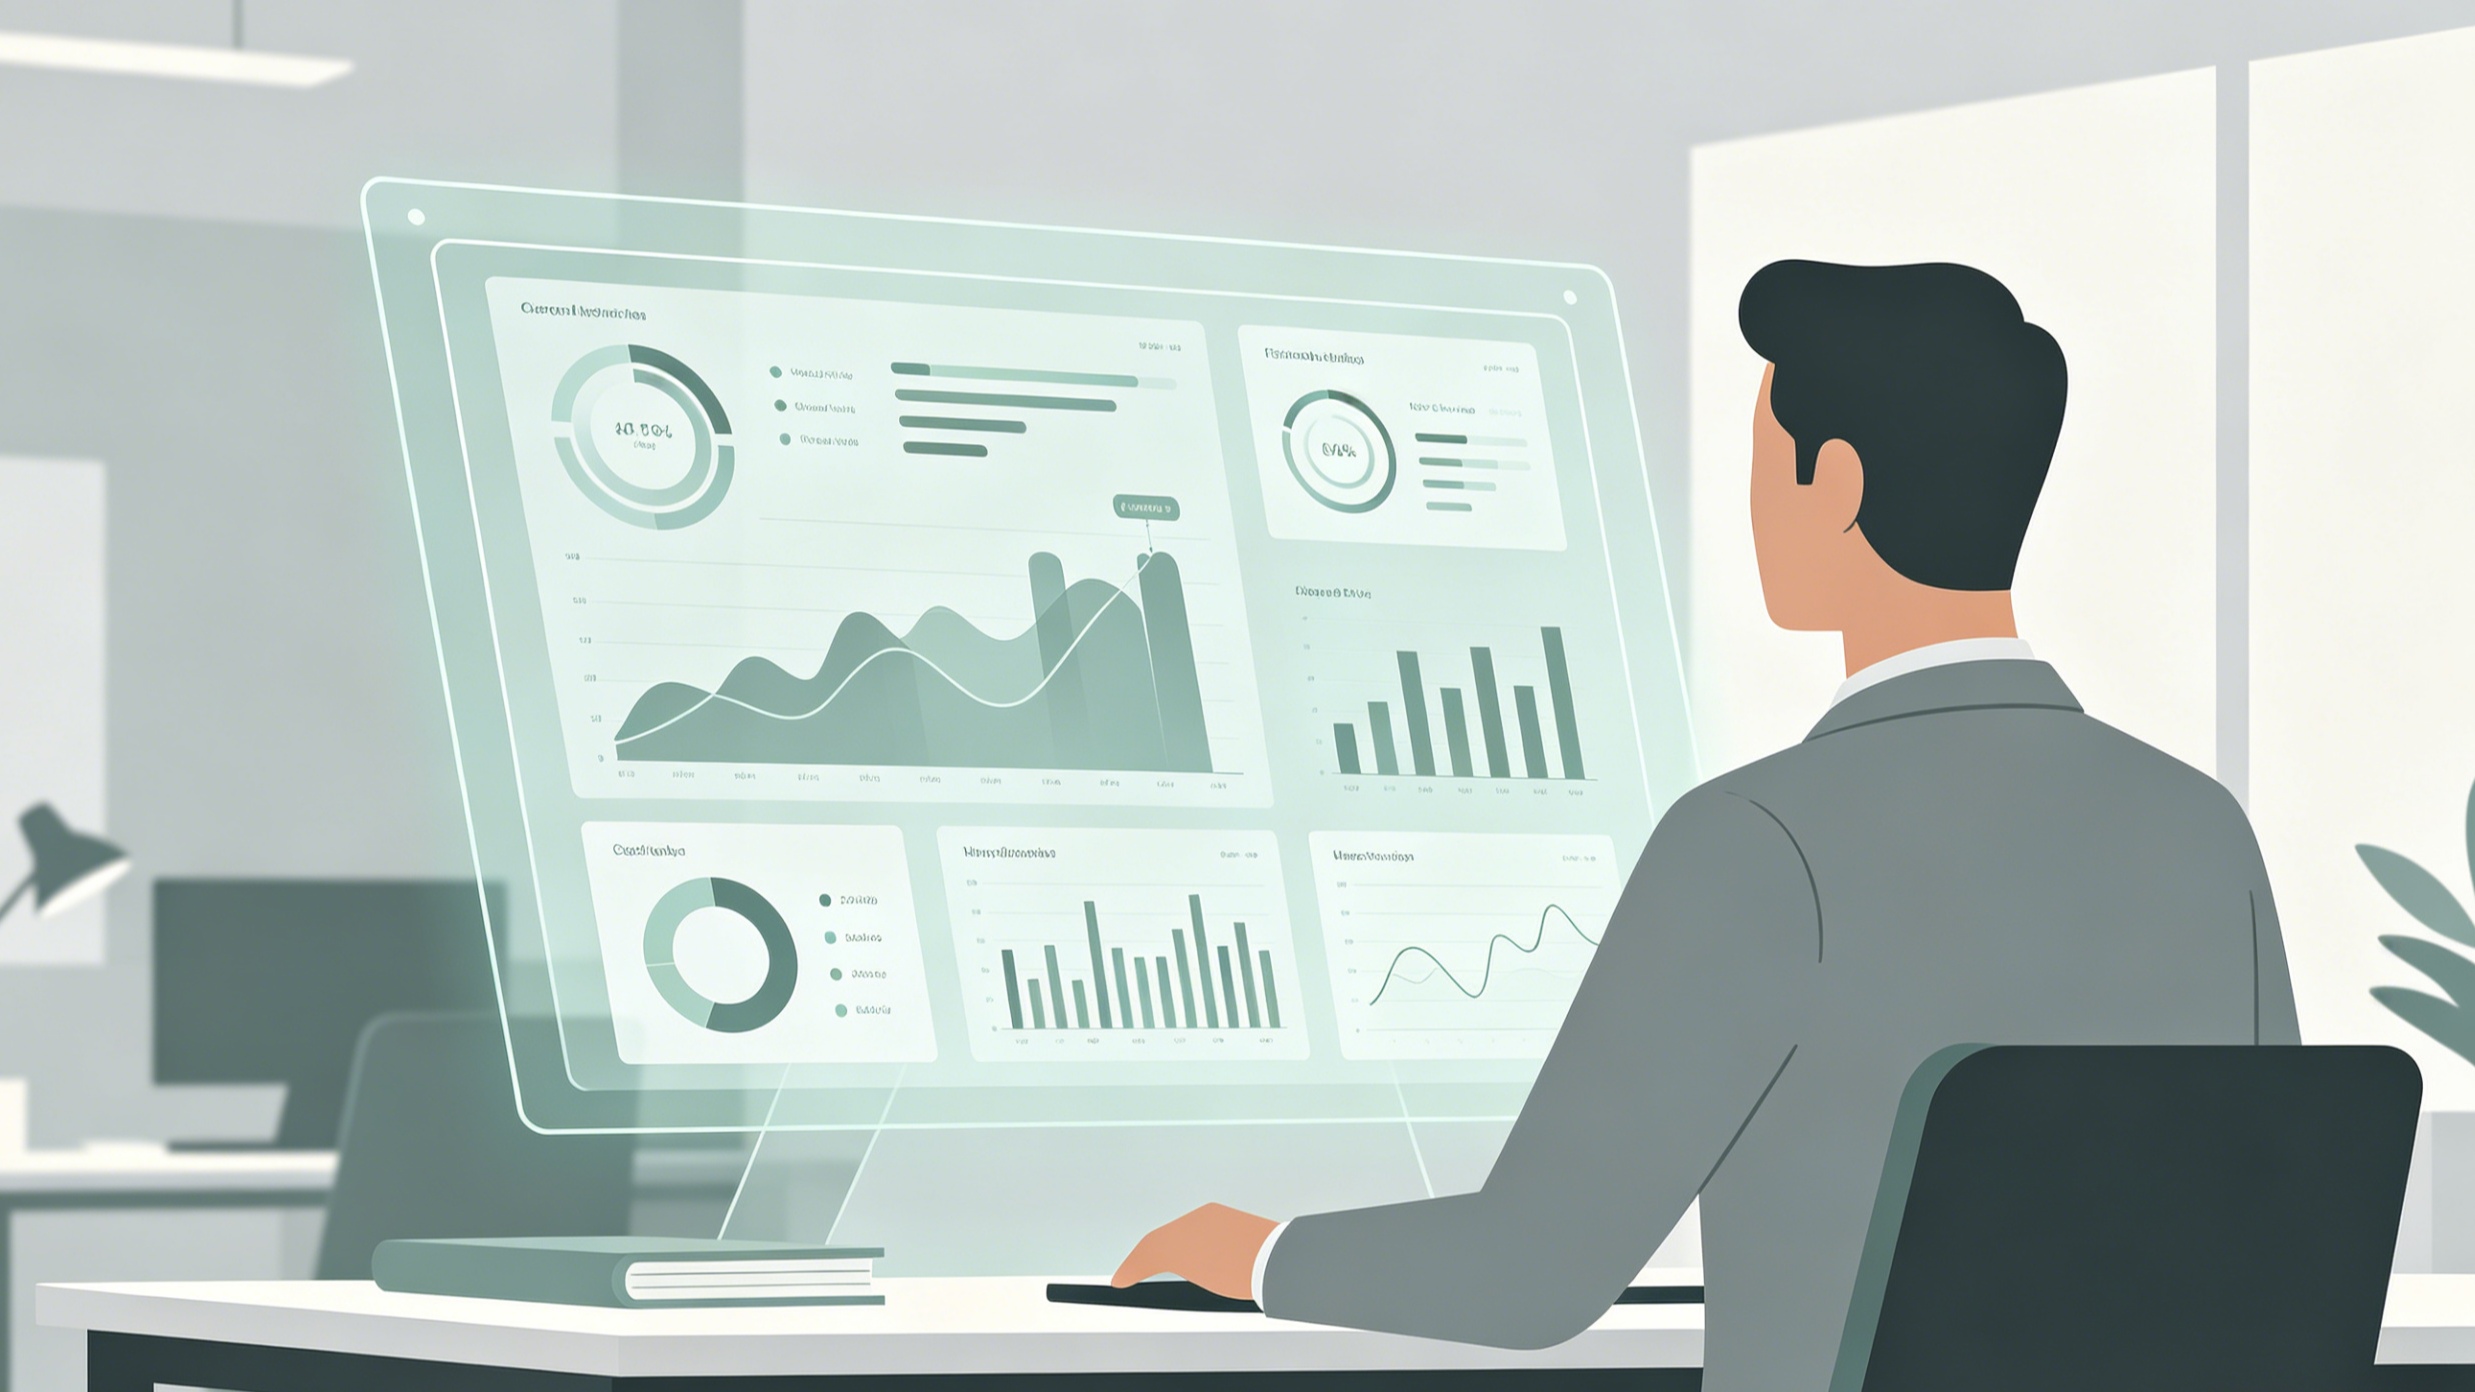
A CEO dashboard should utilize a "Top-Down" visual hierarchy. The most critical metric—usually total revenue or enterprise value—must occupy the top-left quadrant. We have observed that integrating a "Variance Indicator" (e.g., a green or red percentage showing deviation from the plan) allows a CEO to scan the health of the company in less than ten seconds. If the operating margin is red, the CEO knows to dive into the COO or CFO reports immediately.
The CFO Financial Command Center
For a Chief Financial Officer, the dashboard is a tool for risk management and capital allocation. While the CEO looks at growth, the CFO focuses on sustainability and liquidity. A well-designed financial dashboard eliminates the need for manual spreadsheet reconciliation, providing a "single source of truth" for the company's fiscal status.
Vital Financial Metrics
- Cash Flow Forecast: Perhaps the most important metric for any CFO. It visualizes expected inflows and outflows over the next 90 days.
- EBITDA: Earnings Before Interest, Taxes, Depreciation, and Amortization provides a clear picture of core operational profitability.
- Quick Ratio (Acid Test): This measures the company's ability to meet its short-term obligations with its most liquid assets. In high-growth phases, monitoring this prevents "growing broke."
- Debt-to-Equity Ratio: A strategic indicator of how the company is financing its growth and its overall financial leverage.
Strategic Implementation
When we implement CFO dashboards, we emphasize the "Drill-Through" capability. If the "Accounts Receivable" metric shows an upward trend (meaning customers are taking longer to pay), the CFO should be able to click that metric to see which specific clients or regions are lagging. This level of interactivity transforms a static report into an active management tool.
The CMO Growth and ROI Dashboard
The Marketing Executive's dashboard has evolved significantly from "vanity metrics" like likes and shares to "hard metrics" that tie directly to revenue. A CMO dashboard must bridge the gap between creative investment and financial return.
Driving Marketing Accountability
- Customer Acquisition Cost (CAC): The total spend required to gain a new customer. This must be tracked against the budget to ensure scalability.
- Customer Lifetime Value (LTV): The total revenue a business can expect from a single customer account. The LTV/CAC ratio is the ultimate indicator of marketing health.
- MQL to SQL Conversion Rate: Tracks the quality of leads being passed from Marketing to Sales. A breakdown here indicates a lack of alignment between the two departments.
- Return on Ad Spend (ROAS): Granular tracking of which channels (social, search, display) are yielding the highest profit.
Visualizing the Growth Funnel
The CMO dashboard often uses a "Funnel Visualization." By showing the volume of users at the top of the funnel (awareness) vs. the bottom (conversion), the executive can pinpoint exactly where the "leaks" are occurring. In our testing of various CMO layouts, placing a "Channel Performance" bar chart next to the funnel allows for instant reallocation of budget from underperforming channels to those with higher ROI.
The CRO and Sales Velocity Dashboard
For the Chief Revenue Officer or VP of Sales, the dashboard is about momentum. It needs to show not just what has been sold, but what is likely to be sold in the coming weeks and months.
Monitoring the Revenue Engine
- Weighted Pipeline Value: This takes the total value of all open deals and multiplies them by their probability of closing. It provides a realistic revenue forecast.
- Sales Velocity: A complex but vital metric calculated by multiplying the number of opportunities, deal value, and win rate, then dividing by the length of the sales cycle.
- Win Rate by Sales Rep: Identifies high performers and those who may need additional coaching or resources.
- Average Deal Size: Tracks whether the sales team is moving up-market or if the product value proposition is shifting.
Real-Time Pipeline Management
A CRO dashboard should prioritize "Leading Indicators" over "Lagging Indicators." While "Closed Revenue" is important, "New Opportunities Created" tells the executive more about the future health of the company. We recommend using a "Heat Map" to show sales activity by region or product line, allowing for rapid strategic pivots if a particular market shows signs of cooling.
The COO Operational Excellence Dashboard
The Chief Operating Officer focuses on efficiency, quality, and internal execution. This dashboard is often the most diverse, as it may cover everything from supply chain logistics to customer support response times.
Operational KPIs for Efficiency
- Cycle Time: The total time it takes to complete a specific process, whether it’s manufacturing a product or onboarding a new client.
- Resource Utilization: Measures how effectively the company’s assets—both human and physical—are being used.
- Customer Churn Rate: While also a marketing metric, for the COO, churn is often an indicator of operational failure or poor service delivery.
- Operating Expense Ratio (OER): Compares the cost of operating a piece of property or business to the income it generates.
Optimizing Internal Workflows
Operational dashboards benefit from "Status Indicators" or "Traffic Light" systems (Red/Amber/Green). Because the COO manages so many moving parts, they need to ignore what is working and focus exclusively on what is broken. A "Red" alert on "Supply Chain Lead Time" allows the COO to intervene before the delay impacts customer delivery dates.
The CTO and Technology Health Dashboard
In an era where every company is a tech company, the Chief Technology Officer’s dashboard is critical for ensuring that the digital infrastructure can support business growth without collapsing under technical debt.
Technical and Innovation Metrics
- System Uptime (SLA): The percentage of time services are available to users. For SaaS companies, "four nines" (99.99%) is often the benchmark.
- Deployment Frequency: Measures how often the team successfully releases code. This is a proxy for organizational agility.
- Tech Debt Ratio: The cost of fixing problems in the codebase versus the cost of developing new features.
- Mean Time to Recovery (MTTR): How quickly the team can bounce back from a system failure or security incident.
Balancing Innovation and Stability
The CTO dashboard must balance "Velocity" (how fast we are moving) with "Stability" (how reliable the systems are). We have found that a "Scatter Plot" showing feature delivery vs. bug reports provides a visual representation of whether the engineering team is sacrificing quality for speed. This insight is crucial during board meetings when discussing R&D budgets.
The CHRO Human Capital Dashboard
The Chief Human Resources Officer manages the company’s most valuable and expensive asset: its people. This dashboard has shifted from simple headcount tracking to deep insights into engagement, retention, and culture.
Measuring Talent and Culture
- Employee Net Promoter Score (eNPS): A measure of how likely employees are to recommend the company as a great place to work.
- Turnover Rate (Voluntary vs. Involuntary): High voluntary turnover in a specific department is a major red flag for leadership.
- Revenue per Employee: A productivity metric that helps in headcount planning and evaluating the ROI of human capital.
- Diversity and Inclusion (DEI) Metrics: Tracking representation across different levels of the organization to ensure alignment with corporate values and ESG goals.
Human-Centric Strategic Planning
The CHRO dashboard should be used for "Predictive Analytics." For example, if the data shows that turnover increases significantly after the two-year mark for software engineers, the CHRO can implement "stay interviews" or adjusted compensation models before the talent leaves. This proactive approach saves the company thousands in recruitment and training costs.
Design Principles for High-Signal Executive Dashboards
Building a dashboard that an executive will actually use requires a different approach than building a report for an analyst. The goal is "Cognitive Ease."
The Five-Second Rule
An executive should be able to look at any dashboard and understand the "Current State vs. Goal" within five seconds. If they have to search for the meaning of a chart or calculate a number in their head, the dashboard has failed. This is achieved through clear labeling and the use of intuitive color schemes (e.g., green for positive growth, red for decline).
Context is King
A raw number like "$10M Revenue" is meaningless without context. Is that $10M against a $12M goal (failure) or an $8M goal (success)? Every KPI on an executive dashboard should be accompanied by a comparison point:
- Period-over-Period (PoP): Comparison to last month or last quarter.
- Year-over-Year (YoY): Comparison to the same time last year to account for seasonality.
- Budget vs. Actual: Comparison to the strategic plan.
Visual Simplicity and the F-Pattern
The human eye typically scans digital content in an "F" pattern—starting at the top left, moving across, and then down. Therefore, the most critical "Survival Metric" must be in the top-left corner. Secondary metrics should follow, with granular charts occupying the bottom sections. Avoid using "3D" charts or excessive "Chart Junk" that adds no informational value.
Common Executive Dashboard Failures to Avoid
Even with the best tools, many organizations fail to create effective executive dashboards. Recognizing these pitfalls is the first step toward building a better system.
Information Overload (The Kitchen Sink Problem)
The most common mistake is trying to put everything on one screen. When a dashboard contains 30 different charts, it ceases to be a strategic tool and becomes a distraction. We recommend a limit of 5 to 7 high-level widgets per dashboard. If more detail is needed, use the drill-through function.
Lack of Real-Time Automation
If a dashboard requires a team of analysts to manually update a spreadsheet every Monday, it is already outdated by the time the executive sees it. True executive dashboards must be connected directly to the source systems (CRM, ERP, Finance software) via APIs. Real-time data ensures that leaders are reacting to the world as it is, not as it was a week ago.
Ignoring the "Why"
A dashboard can show that sales are down, but it might not show why. Executive-level reporting should allow for "Annotations." When a metric goes "Red," the responsible department head should be able to attach a brief note explaining the anomaly and the corrective action being taken. This keeps the executive informed without requiring a separate meeting.
How to Operationalize Your Executive Dashboard Strategy
To move from data chaos to a streamlined dashboard ecosystem, follow these steps:
- Define the Questions: Before picking a tool, sit down with each executive and ask, "What are the three questions you need to answer every morning to know if the company is healthy?"
- Audit the Data Sources: Ensure that the data in your CRM (like Salesforce) matches the data in your Finance tool. Inconsistent data is the fastest way to lose executive trust.
- Prototype and Iterate: Create a "wireframe" or a low-fidelity version first. Let the executive use it for a week and provide feedback on which metrics they actually found useful.
- Select the Right BI Tool: Whether using Power BI, Tableau, or a specialized executive reporting platform, ensure it offers mobile responsiveness. Executives often need to check their "cockpit" while traveling or between meetings.
Summary of Executive Dashboard Value
Executive dashboards are more than just pretty pictures; they are strategic assets that drive organizational alignment. By tailoring dashboards to specific roles—CEO, CFO, CMO, CRO, COO, CTO, and CHRO—an organization ensures that every leader has the specific insights they need to execute the company's vision.
The transition from "gut-feeling" leadership to "data-driven" leadership happens at the dashboard level. When the entire C-suite is looking at the same real-time data, silos break down, communication improves, and the organization becomes more agile. In a competitive market, the speed of decision-making is often the ultimate competitive advantage, and the executive dashboard is the engine that powers that speed.
Frequently Asked Questions
What is the difference between an operational dashboard and an executive dashboard?
An operational dashboard focuses on the "how"—tracking daily tasks, specific project milestones, and individual employee performance. An executive dashboard focuses on the "what" and the "result"—tracking high-level strategic goals, financial health, and overall market position.
How often should an executive dashboard be updated?
Ideally, executive dashboards should update in real-time or near-real-time. At a minimum, data should be refreshed daily. Weekly updates are often too slow for modern high-growth environments where market conditions can shift in hours.
Should executives have access to all department dashboards?
While transparency is generally good, "Information Overload" is a real risk. A CEO should have a high-level summary of all departments but should only dive into specific departmental dashboards when a red flag is raised in the master strategic report.
What is the best chart type for an executive dashboard?
Simple is always better. Bar charts are excellent for comparisons, line charts are best for trends over time, and "Big Number" widgets (gauges) are perfect for showing progress toward a single target. Avoid pie charts if you have more than three categories, as they are difficult to read quickly.
-
Topic: Executive Dashboards: 13 Examples, Templates & Best Practiceshttps://improvado.io/blog/executive-dashboards
-
Topic: 10 Examples Of The Most Useful Executive Dashboards - Dotnet Report | Embedded Self-Service BI & Reporting | .NET Ad Hoc Report Builderhttps://dotnetreport.com/blogs/executive-dashboard/
-
Topic: 9 Executive Dashboard Examples for CEOs to Power Up | DashThishttps://dashthis.com/blog/executive-dashboard-examples